Unlock a world of possibilities! Login now and discover the exclusive benefits awaiting you.
QlikView documentation and resources.
Recent Documents
-
Set Analysis for certain Point in Time
Hi All,Sometimes there may be requirements from users where they want to see the charts in from certain point of time like YTD, QTD, MTD, Last 5 Years... Show MoreHi All,
Sometimes there may be requirements from users where they want to see the charts in from certain point of time like YTD, QTD, MTD, Last 5 Years etc., please find the set analysis expressions for this type of scenarios.
YTD Sales (Year To Date)
Sum({<Year=, Quarter=, Month=, Week=, Date={‘>=$(=YearStart(Today()))<=$(=Today())’}>} Sales )
Note: Year=, Quarter=, Month=, Week= excludes the selections in Year, Quarter, Month and Week dimensions.
QTD Sales (Quarter To Date)
Sum({<Year=, Quarter=, Month=, Week=, Date={‘>=$(=QuarterStart(Today()))<=$(=Today())’}>} Sales)
MTD Sales (Month To Date)
Sum({<Year=, Quarter=, Month=, Week=, Date={‘>=$(=MonthStart(Today()))<=$(=Today())’}>} Sales)
WTD Sales (Week To Date)
Sum({<Year=, Quarter=, Month=, Week=, Date={‘>=$(=WeekStart(Today()))<=$(=Today())’}>} Sales)
Last 5 Years Sales
Sum({<Year=, Quarter=, Month=, Week=, Date={‘>=$(=YearStart(Today(), -4))<=$(=Today())’}>} Sales )
Last 6 Quarters Sales
Sum({<Year=, Quarter=, Month=, Week=, Date={‘>=$(=QuarterStart(Today(), -5))<=$(=Today())’}>} Sales )
Last 12 Months Sales
Sum({<Year=, Quarter=, Month=, Week=, Date={‘>=$(=MonthStart(Today(), -11))<=$(=Today())’}>} Sales )
Last 15 Weeks Sales
Sum({<Year=, Quarter=, Month=, Week=, Date={‘>=$(=WeekStart(Today(), -14))<=$(=Today())’}>} Sales )
Last 10 Days Sales
Sum({<Year=, Quarter=, Month=, Week=, Date={‘>=$(=Date(Today()-9))<=$(=Today())’}>} Sales )
Yesterday Sales
Sum({<Year=, Quarter=, Month=, Week=, Date={‘$(=Date(Today()-1))’}>} Sales )
You can also arrive some flags for above scenarios in script and you use those flags in Set Analysis expression if your data always based on Current Date. Refer below link created by Richard.Pearce60
Calendar with flags making set analysis so very simple
Hope this helps.
Regards,
Jagan.
-
Example of Selecting Multiple Field Values
In this post, I will demonstrate how to programmatically select multiple values in a field.We know that manually, we can select multiple field values ... Show MoreIn this post, I will demonstrate how to programmatically select multiple values in a field.
We know that manually, we can select multiple field values by pressing down on the Ctrl button and selecting the values in the field one at a time.
Screenshot of two values selected in the Year field:
There may be times when you have a requirement to pre-select multiple values programmatically, for example the current and previous months need to be selected when the document is opened.
Selecting multiple field values can be done through Actions.
The following steps illustrate how to add an Action to select 2013 and 2014 values in the Year field for a button (Actions can be added to other objects, such as the Sheet, Document, etc.):
- Go to the Properties of the button object
- Navigate to the Actions tab and add a new Action
- Choose the Selection for Action Type and choose Select in Field for Action
- In the Field textbox, enter the field name, in this example Year
- In the Search String textbox, enter the values to be selected, separated by the vertical bar | and enclosed in parentheses (), in this example (2013|2014)
The following screenshot illustrates the values 2013 and 2014 for the Year field:
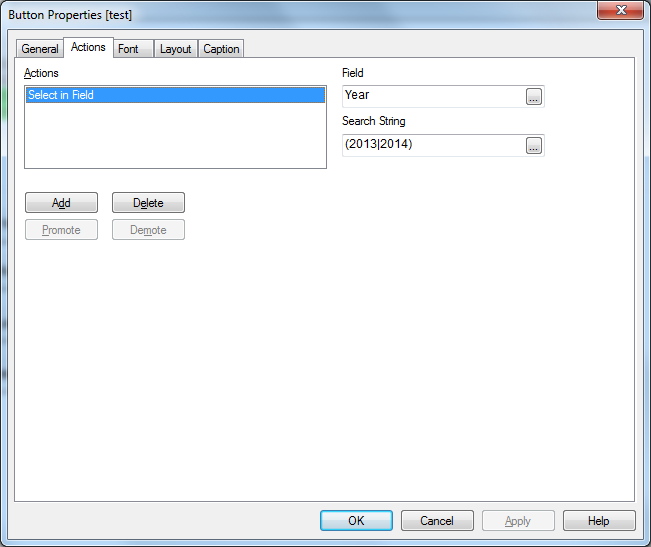
When you press on the button, both 2013 and 2014 values should be selected together in the Year field.
Using Expressions:
The search string can also take expressions using the following syntax:
='(' & Expression1 & '|' & Expression2 & ')'
An example of using an expression to determine last and next month from today’s month:
='(' & Month(AddMonths(Date(Today()), -1)) & '|' & Month(AddMonths(Date(Today()), +1)) & ')'
An example of using variables for current and previous months:
='(' & $(vCurrentMonth) & '|' & $(vPreviousMonth) & ')'
Sample Application:
This post includes a sample application that illustrates a few options for selecting multiple values in a field.
Hope this post was helpful to you.
-
Standard Deviation (Population vs. Sample)
Inspired by swuehl's response here: Help with Standard deviation Full population No... | Qlik Community I thought it make sense to share a way to cal... Show MoreInspired by swuehl's response here: Help with Standard deviation Full population No... | Qlik Community I thought it make sense to share a way to calculate population standard deviation as QlikView's Stdev() seems to be a sample standard deviation. The difference between the two becomes negligible as the number of data point increases, but there might be a use case to apply population standard deviation for a smaller dataset.
I start with no dimension in an Excel file
If you look at the statestic box, you will see that the standard deviation will show the sample stdev number
Also, when you use =Stdev(Data1), it will show the same number as above. In order to get population stdev, all you need to do is to multiple the standard deviation with this
=Stdev(Data1) * sqrt((Count(Data1)-1)/Count(Data1))
In other words, I am multiplying the Sample standard deviation with Sqrt((Number of Observations - 1)/Number of observations). So, for the above sample it would be Sqrt(9/10).
And the same logic can be carry forward to a table to create confidence intervals using TOTAL qualifer
Sample
=Stdev(TOTAL Data1)
Population
=Stdev(TOTAL Data1) * sqrt((Count(TOTAL Data1)-1)/Count(TOTAL Data1))
Same idea can be applied if you want to calculate Sample or Population Standard Deviation by Dimension
In the a chart, you can use these expressions
Sample
=Stdev(TOTAL <Region> Data3)
Population
=Stdev(TOTAL <Region> Data3) * sqrt((Count(TOTAL <Region> Data3)-1)/Count(TOTAL <Region> Data3))
-
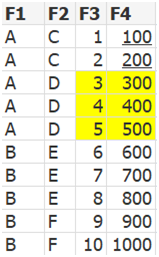
Aggr() and set analysis: set modifiers inside and / or outside aggr()?!?
Hi community,"Where should the set modifier be placed? Inside and/or outside the aggr()?"The standard answer is mostly:"If you are unsure, you should ... Show MoreHi community,
"Where should the set modifier be placed? Inside and/or outside the aggr()?"
The standard answer is mostly:
"If you are unsure, you should place the set modifiers inside and outside the aggr(). This will probably lead to the desired result..."
I just can't agree. In my opinion it really, really! depends...


Example 1
sum(aggr(sum(F4),F1))
--> default case
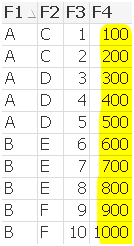
sum(aggr(sum({<F2={"D","E"}>} F4),F1))
--> set modifier at inner aggregation limits F4 values
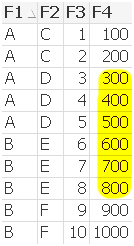
sum({<F2={"D","E"}>} Rangesum(F3,aggr(sum(F4),F1)))
--> set modifier at outer aggregation
--> no difference , because F1={A} exists for F2={D} and F1={B} exists for D2={E}
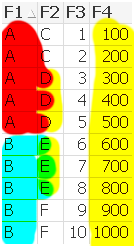
sum({<F2={"D"}>} aggr(sum(F4),F1))
--> set modifier at outer aggregation
--> F1={A} exists for F2={D} and F1={B} doesn‘t exist for D2={E}
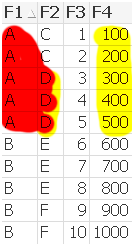
sum({<F2={"D"}>} aggr(sum({<F2={"D"}>}F4),F1))
--> set modifier at inner and outer aggregation
--> F1={A} exists for F2={D} and F1={B} doesn‘t exist for D2={E}
--> set modifier at inner aggregation limits F4 values

Example 2
sum(Rangesum(F3,aggr(sum(F4),F1)))
--> default case
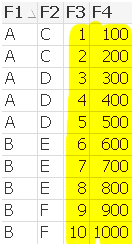
sum(Rangesum(F3,aggr(sum({<F2={"D","E"}>} F4),F1)))
--> set modifier at inner aggregation limits F4 values inside aggr()
--> but doesn’t limit F3 outside aggr()
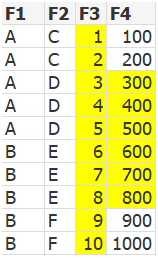
sum({<F2={"D","E"}>} Rangesum(F3,aggr(sum(F4),F1)))
--> set modifier at outer aggregation limits only F3 field, because F1={A} exists for F2={D} and F1={B} exists for D2={E}
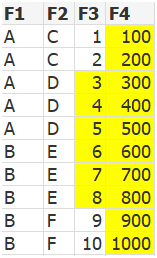
sum({<F2={"D"}>} Rangesum(F3,aggr(sum(F4),F1)))
--> set modifier at outer aggregation
--> limits F3 and F4, because F1={A} exists for F2={D} and F1={B} doesn‘t exist for D2={E}

sum({<F2={"D"}>} Rangesum(F3,aggr(sum({<F2={"D"}>} F4),F1)))
--> set modifier at inner and outer aggregation limts F3 and F4 values
Regards
Robin
-
YTQ, QTD, MTD and WTD
Year, Quarter, Month and Week To Date are the common analysis that I seen many applications. I will share the expression to do hereFirst to do this yo... Show MoreYear, Quarter, Month and Week To Date are the common analysis that I seen many applications. I will share the expression to do here
First to do this your data model should have the DateField in number format by applying floor
Similar to this
Floor(DateField) AS DateNum //it will gives you one whole number to represent date
YTD - Year To Date
A date should be selected and it will look for the Starting date of the year to the selected date.
Ex: date selected is 21-03-2014 then YTD is 01-01-2014 to 21-03-2014
Expression would be
Sum({<Year=, Month=, Quarter=, Week=, DateField=, DateNum={">=$(=Num(YearStart(Max(DateNum))))<=$(=Max(DateNum))"}>} Sales)
QTD- Quarter to Date
In the place of year use Quarter
Sum({<Year=, Month=, Quarter=, Week=, DateField=, DateNum={">=$(=Num(QuarterStart(Max(DateNum))))<=$(=Max(DateNum))"}>} Sales)
MTD- Month to Date
Sum({<Year=, Month=, Quarter=, Week=, DateField=, DateNum={">=$(=Num(MonthStart(Max(DateNum))))<=$(=Max(DateNum))"}>} Sales)
WTD- Week to Date
Sum({<Year=, Month=, Quarter=, Week=, DateField=, DateNum={">=$(=Num(WeekStart(Max(DateNum))))<=$(=Max(DateNum))"}>} Sales)
if you want you can set a variable value as 'Year', 'Month', 'Quarter', 'Week', lets say vToDate and go with single chart and single expression
Sum({<Year=, Month=, Quarter=, Week=, DateField=, DateNum={">=$(=Num($(=vToDate& 'Start(Max(DateNum))')))<=$(=Max(DateNum))"}>} Sales)
Will keep your expression simple
Regards,
Celambarasan
-
Replace characters with Ascii numbers in a string
Hi,The below code helps in replacing characters with ASCII codes in a string in Load script For exampleABC is converted to 656667- since ASCII code of... Show MoreHi,
The below code helps in replacing characters with ASCII codes in a string in Load script
For example
ABC is converted to 656667- since ASCII code of A is 65, B is 66 and C is 67.
CharMap:
Mapping LOAD
Chr(RecNo() - 1) AS Char,
RecNo() - 1 AS Asciicode
AutoGenerate 256;
Data:
LOAD
Text,
MapSubString('CharMap', Text) as formattedText
FROM DataSource;
Hope this helps.
Regards,
Jagan.
-
Linking to two or more dates
This tutorial presents a script pattern for assigning time dimensions to multiple fact dates in a data model. It answers the commonly asked Forum ques... Show MoreThis tutorial presents a script pattern for assigning time dimensions to multiple fact dates in a data model. It answers the commonly asked Forum question "how do I link to two dates"?
The pattern will demonstrate how to link all fact dates to a common calendar as well as using separate calendars for each fact date.
-
How to use - Master-Calendar and Date-Values
Dimensions and calculations over periods are essential parts from nearly each reporting. The analysis from data regarding to periods is quite independ... Show MoreDimensions and calculations over periods are essential parts from nearly each reporting. The analysis from data regarding to periods is quite independent from the to analyse data-area regardless if this are sales-, finance-, human-ressources- or production-data. Nearly nothing is more exciting within an analysis as the development from data over the time and the questions which are following like: Was these development expected or not and what could be the reasons?
However the handling from time-data could be difficult whereas the most could be avoided with a few simple rules.
The easiest way is often to use a master-calendar as dimension-table which is linked to the fact-table(s). Why and how, see:
The Fastest Dynamic Calendar Script (Ever)
Master Calendar with movable holidays
In more complex data-models is it often necessary to create several calendars and/or to use calendars which are divergent to normal year-calendars.
Why You sometimes should Load a Master Table several times
Fiscal Calendar with Non-Standard Days (Not 1-31)
Important is to define and formate the time-dimension properly. Properly meant that the dimensions are (also) numeric then only numeric values could be calculated respectively compared with each other.
Background is that the date of 12/31/1899 is equal to 1 and each further day will be added by one so that the date of 12/31/1999 corresponds to 36525. Hours/Minutes/Seconds are fractions from 1, for example 1 / 24 / 60 = 0,000694 is equal to 1 minute.
This meant that all fields which should be calculated (comparing is calculation, too) should be (additionally) available as numeric field or as Dual-Field:
Often are additionally relative and/or continuing time-dimensions and flags very helpful to avoid complex calculations:
Creating Reference Dates for Intervals
Calendar with flags making set analysis so very simple
Period Presets: Compare Periods on the fly
Subroutine to Create Data Model for From/To Date Selection
Calendar with AsOf Flags, Compare Easter to Easter
Beside simple but frequent time-comparing with one or several time-dimensions in one object and simple expressions like sum(value) or count(order) are there more complicated questions like:
Previous YTQ, QTD, MTD and WTD
Calculating rolling n-period totals, averages or other aggregations
Beside the above used links you will find many interessting postings here within the qlik community to these topic - the notes here are a good starting point to go further.
Have fun!
ps: within the attachment is a german translation - deutsche Fassung.
-
Loading Multiple Excel Sheets Dynamically along with file name and sheet name
Hi All,This document helps you in loading multiple excels and excel sheets with the name of the sheet and data.//to read each file from the specified ... Show MoreHi All,
This document helps you in loading multiple excels and excel sheets with the name of the sheet and data.
//to read each file from the specified folder
FOR EACH file in FileList('filepath\*.xlsx');
//In order to get the file information from SQLtables command making use of the ODBC connection format
ODBC CONNECT32 TO [Excel Files;DBQ=$(file)];
tables:
SQLtables;
DISCONNECT;
FOR i = 0 to NoOfRows('tables')-1
LET sheetName = purgeChar(purgeChar(peek('TABLE_NAME', i, 'tables'), chr(39)), chr(36));
Table:
Load * ,
FileBaseName()as FIle,
FileDir() as Dir,
FileName() as File_Name,
'$(sheetName)' as Sheet_name
From $(file)(ooxml, embedded labels, table is [$(sheetName)]);
NEXT i
NextHope this helps !!!
please find the attachment for the eg: qvw and test fiels
Regards,
-
Set Analysis: syntaxes, examples
For those that find this document in a search - you may also want to check out these videos to learn Set Analysis:A Beginners' Introduction to Set Ana... Show MoreFor those that find this document in a search - you may also want to check out these videos to learn Set Analysis:
A Beginners' Introduction to Set Analysis
About the attached document:
The doc is organized by question:
- to select all or just known members
- to select through search strings, variables that can store just members but also the whole set
- to select using two fields, a boolean test, a function like concat(), sum(), p() or e(), rank()
In this updated version, I have added some few sections and some examples.
It is a translation of a french doc I have written few weeks ago: http://community.qlik.com/docs/DOC-4889 -
Month Freeze Document
Hi Folks, If any one interest to freeze all the data by month wise from sql and append it in the qvd to verify the changes per each month. It will hel... Show MoreHi Folks,
If any one interest to freeze all the data by month wise from sql and append it in the qvd to verify the changes per each month. It will help it.
Let vQVDPath = 'D:\';
Let vFreezeTableName = 'MONTH_FREEZE';
LET vNow = Now();
//GFIR
$(vFreezeTableName):
LOAD *,
'$(vNow)' AS MonthFreezeTime,
Floor(Today()) AS MonthFreezeDate,
Floor(MonthEnd(Today(), -1)) AS MonthFreezeDataUptoDate;
SQL Select * from tablename;
//Check the qvd is exists or not
LET vListQVDExists = not isnull(QVDCreateTime('$(vQVDPath)\$(vFreezeTableName).qvd'));
//If exists , concatenate with existing qvds
If($(vListQVDExists)) then
//Find the maximum date
MaxFreezeDate:
LOAD Max(MonthFreezeDate) AS MaxFreezeDateNum Resident $(vFreezeTableName);
//Get the maximum date_num
Let vMaxFreezeNum = Num(Peek('MaxFreezeDateNum',-1, 'MaxFreezeDate'));
//Drop the temporary table
DROP Table MaxFreezeDate;
Concatenate($(vFreezeTableName))
LOAD * From
$(vQVDPath)\$(vFreezeTableName).qvd(qvd)
Where MonthFreezeDate < $(vMaxFreezeNum);
ENDIF;
//Store freeze data into qvd
STORE $(vFreezeTableName) into $(vQVDPath)\$(vFreezeTableName).qvd(qvd);
//Drop the temporary table
DROP Table $(vFreezeTableName);
//Exit script
EXIT Script;
-
Functions Cheatsheet.pdf
Hello Everyone,I have attached the document for the important Qlikview functions used in script as well as in UI.Please have a look and also feel free... Show MoreHello Everyone,
I have attached the document for the important Qlikview functions used in script as well as in UI.
Please have a look and also feel free to update the document or comment in the session for the functions which is missed.
-
QlikView App - Show and Hide Sheets based on User or Menu
As QlikView applications grow the number of tabs that information is spread across can grow rapidly as well. The new Ajax view makes it easier to na... Show MoreAs QlikView applications grow the number of tabs that information is spread across can grow rapidly as well. The new Ajax view makes it easier to navigate when there are many tabs (with the drop down) but if users are using the IE Plugin or an older version of QlikView a lot of the screen can be taken up with tabs.
One way of solving this is to group the tabs into functional areas and place a menu on the welcome tab that allows the user to select which functional area they want to look at.
Furthermore, if some tabs are simply not relevant to some users then it is possible to hide those tabs (and the menu options to show them) from those users.
This document gives an example of a menu that switches tabs on and off and implements hiding of tabs from users based on their OSUser name - loaded from an Inline table in the load script.
I hope you find this document useful, you can find links to other documents I have uploaded here: http://www.quickintelligence.co.uk/qlikview-examples/
Steve
-
Intervalmatch example – with dates
I have two tables Table1,Table2. Table1 has DATE, Table2 has START_DT,END_DT. Want to join these two tables on DATE columns.Intervalmatch function wil... Show MoreI have two tables Table1,Table2. Table1 has DATE, Table2 has START_DT,END_DT. Want to join these two tables on DATE columns.Intervalmatch function will help us to make the join in Qlik. If we use left join, we can avoid synthetic tables too. Here is the example.If you want to test, prepare the test data.
Let me know if you need any more info/clarification.
Table1:
LOAD COUNTRY,
DATE,
C1,
C2
FROM Table1;
Table2:
LOAD COUNTRY, C3,C4,
date(START_DT) as START_DT,
date(END_DT) as END_DT
FROM Table2;
Final_Table:
INTERVALMATCH (DATE) left JOIN LOAD START_DT, END_DT RESIDENT Table2;
left Join (Table1) LOAD distinct * RESIDENT Table2;
DROP TABLE Table2; -
Qlik Google Drive & Spreadsheet connector Steps
Hi Folks,This document provide steps to fetch the google spreadsheet information and use in qlikview by using "Qlik Google drive & Spreadsheet connect... Show MoreHi Folks,
This document provide steps to fetch the google spreadsheet information and use in qlikview by using "Qlik Google drive & Spreadsheet connector".
Hope this will help the beginner to use it.
-
Partial Reload in Qlikview
Partial ReloadLoading data into Qlikview, we are having two data load options.They are, Full Reload – Load entire data, even, If the file havin... Show More -
QV10 Functions Cheatsheet
This cheatsheet has most of the commonly used functions categorized very well.It is really useful for beginners.Thanks,Vidya -
Let's read Qlik
Greetings to all.I love Qlik, but lately I do not have enough time to keep track of everything that happens.I have to visit many resources for reading... Show MoreGreetings to all.
I love Qlik, but lately I do not have enough time to keep track of everything that happens.
I have to visit many resources for reading news, articles, tricks, videos.
I set myself the goal of being aware of everything, and spend no more than 5 minutes a day on it.
What can help us with this, of course RSS!
For a long time I tried to find a decent and at the same time a simple program for reading rss's ... and found - QuiteRSS (https://quiterss.org/).
Then I started to compile a list of interesting sites for me and add them to QuiteRSS.
At the moment, there is no particular hierarchy of feed, but I think that it will be needed.
Yes, I am sure that there are other sources of information, but I have not found them.
I propose to work on this issue together and lead an acute list.
Git Repo : https://gitlab.com/bintocher/QlikRSS
Can't attach new file, so link : https://gitlab.com/bintocher/QlikRSS/raw/master/qlik%20docs.opml
Updated 2019.01.22 - now total 53 rss feeds ; updated qlik community rss links
-
White Paper - QlikView Migration Guidelines.pdf
Hi,Sharing a document on the Qlikview Migration guidelines. I found this to be very useful when planning to migrate the Qlikview to the latest version... Show MoreHi,
Sharing a document on the Qlikview Migration guidelines. I found this to be very useful when planning to migrate the Qlikview to the latest version.
Regards,
SJ
-
How to reload Qlikview application on every Monday?
How to reload Qlikview application on every Monday?///$tab MainSET ThousandSep=',';SET DecimalSep='.';SET MoneyThousandSep=',';SET MoneyDecimalSep='.'... Show MoreHow to reload Qlikview application on every Monday?
///$tab Main
SET ThousandSep=',';
SET DecimalSep='.';
SET MoneyThousandSep=',';
SET MoneyDecimalSep='.';
SET MoneyFormat='$#,##0.00;($#,##0.00)';
SET TimeFormat='h:mm:ss TT';
SET DateFormat='M/D/YYYY';
SET TimestampFormat='M/D/YYYY h:mm:ss[.fff] TT';
SET MonthNames='Jan;Feb;Mar;Apr;May;Jun;Jul;Aug;Sep;Oct;Nov;Dec';
SET DayNames='Mon;Tue;Wed;Thu;Fri;Sat;Sun';
SET vMonthStartDay=WeekDay(Monthstart(today()));
SET vWeekStartDay=WeekDay(Weekstart(today()));
///$tab Tab1
If $(vMonthStartDay)='Mon' or $(vWeekStartDay)='Mon' THEN
Tab1:
Load * inline [
A,S
1,2
];
elseif ;
///$tab Tab2
If $(vMonthStartDay)='Mon' or $(vWeekStartDay)='Mon' THEN
Tab2:
Load * inline [
A,S
1,2
];
elseif ;
///$tab Tab3
If $(vMonthStartDay)='Mon' or $(vWeekStartDay)='Mon' THEN
Tab3:
Load * inline [
A,S
1,2
];
elseif ;
///$tab Tab4
If $(vMonthStartDay)='Mon' or $(vWeekStartDay)='Mon' THEN
Tab4:
Load * inline [
A,S
1,2
];
elseif ;


